Showing posts sorted by relevance for query federal debt. Sort by date Show all posts

Monday, July 18, 2016

CBO: Long-Term Budget Outlook Worse than Last Year

CBO: Long-Term Budget Outlook Worse than Last Year:
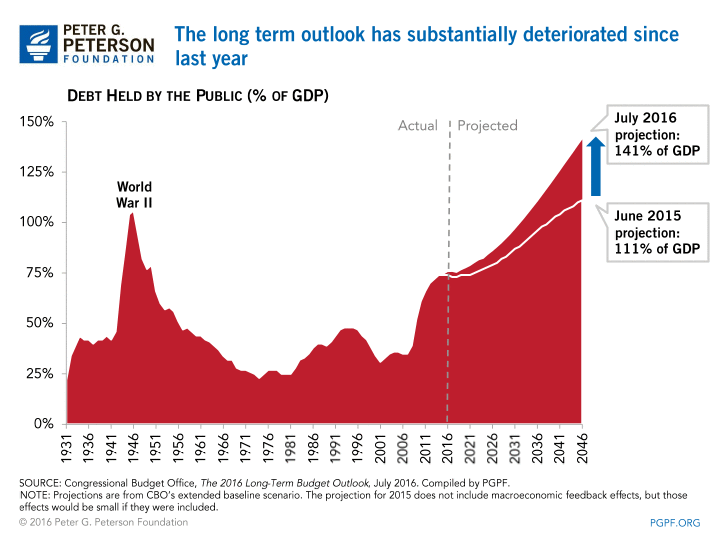
"In its 2016 Long-Term Budget Outlook, the non-partisan Congressional Budget Office (CBO) warns that federal debt is on an unsustainable path. 
Under current law, federal debt is now projected to reach 141 percent of gross domestic product (GDP) within 30 years. 
Unless policymakers act, CBO concludes that rising debt could jeopardize long-term economic growth, crowd out critical public investments, reduce policymakers’ flexibility to respond to unforeseen events, and raise the risk of a fiscal crisis.
The long-term budget outlook has deteriorated significantly since last year, when CBO projected debt would reach 111 percent of GDP in 30 years under current law. This deterioration stems largely from the enactment of legislation at the end of 2015 that made a number of temporary tax provisions permanent.
In the new report, CBO finds that:
    The long term outlook has substantially deteriorated since last year
  • Federal debt is projected to climb to 141 percent of GDP under current law by 2046.
  • Rising debt is a result of a structural imbalance between revenues and spending: under current law, spending growth, which is fueled primarily by the aging of the population and growing healthcare costs, significantly outpaces the projected growth in revenues.
  • As the debt grows and interest rates rise, interest costs are projected to increase rapidly: by 2022, they could exceed what the federal government has historically spent on R&D, infrastructure, and education combined, and could exceed them by more than two times by 2046. In fact, over the next 10 years, the federal government will spend $5.8 trillion on interest.
  • Rising debt will harm our economy and slow the growth of productivity and wages. On our current path, the annual income loss for a 4-person family would be $12,000 by 2046, on average.
...The National Debt Is on an Unsustainable Path
CBO estimates that federal debt, which is already at high levels, will climb significantly over the next 30 years. In CBO’s latest projections, debt is expected to climb from 75 percent of GDP in 2016 to 141 percent of GDP in 2046, based on current law.

Debt at those levels would be unprecedented
Over the past 50 years, debt has averaged only 39 percent of GDP and, as recently as 2007, it was as low as 35 percent of GDP. 
Since 1790, our debt has never exceeded 100 percent of GDP, except for a brief time during World War II when it peaked at 106 percent, after which the debt fell rapidly as a share of GDP..."

Monday, October 24, 2016

What You Need to Know About the National Debt, in 2 Charts

What You Need to Know About the National Debt, in 2 Charts
(Chart by John Fleming/The Heritage Foundation)
The fact that the national debt jumped by $1.4 trillion in one short year should spur Congress to put an end to this excess.
The debt hit a record-breaking high of $19.6 trillion at the close of the federal government’s 2016 fiscal year on Sept. 30. 
It had totaled $18.1 trillion at the end of the previous fiscal year.
The gross national debt includes intragovernmental debt, or debt the federal government owes to itself—for example, to the Social Security trust fund—in addition to debt held by the public.
Federal debt held by the public, or money the government borrowed in financial markets, rose from $13.1 trillion to $14.1 trillion over fiscal 2016. 
That’s an increase of $1 trillion.
Federal debt held by the public now exceeds 75 percent of what the economy produced, as measured by gross domestic product. 
To put this into perspective, debt owned by the public surpassed 70 percent of GDP during only one other time in American history—from 1944 to 1950, due to the large expenditures for World War II.
The debt not only has skyrocketed but is projected to increase as budget deficits rise due to excessive spending. Social Security, Medicare, and Medicaid—three programs affected by the aging and retirement of the baby boomers—are especially key.
These three programs, along with interest on the debt and Obamacare, are projected to make up 83 percent of increased spending over the next decade. 
To seriously control spending and debt, Congress must alter the authorizing statutes of the programs.
Growing spending fuels the growth in debt. 
The Congressional Budget Office projects that the debt will rise to 86 percent of GDP by 2026, to 106 percent by 2035, and to 141 percent by 2046.
161023_debt_chart2_bocciaAmerica continues on this path of unsustainable debt, we likely will face negative consequences such as higher interest costs, slower economic growth, and a greater chance of a fiscal crisis.
According to the CBO, “a large amount of federal debt will reduce the nation’s output and income below what would occur if the debt was smaller....” Read on!

Thursday, August 18, 2016

News - Can America's Debt Growth Be Stopped?

News - Can America's Debt Growth Be Stopped? | Heartland Institute
"Poulson believes that both Hillary Clinton and Donald Trump lack credibility when it comes to facing this nation's federal debt crisis.
For Dr. Barry Poulson, University of Colorado's Emeritus Professor of Economics, and co-author of  "Can the Debt Growth Be Stopped?" the nation's debt crisis is an urgent issue that must be addressed in this year's election.
Poulson explained the seriousness of the issue at an event August 3rd at Heartland Institute in Arlington Heights.
Poulson believes that both Hillary Clinton and Donald Trump lack credibility when it comes to facing this nation's federal debt crisis, as neither candidate is offering solutions that would halt the federal debt from continuing to grow at an unsustainable rate.  
Hillary Clinton wants to increase taxes on the wealthy to fund her ambitious federal program. 
Trump is proposing a tax cut that would definitely reduce revenues over the next decade by $10 trillion.  
Furthermore, Clinton wants to significantly boost entitlements; 
Trump want entitlement spending protected.
The economics professor cited how the Congressional Office is projecting federal debt increase to equal more than 100% of the national debt over the next decade.
For him, it's highly questionable whether higher tax rates would increase tax revenues in the long run. Instead, they would foster retardation and stagnation in economic growth.
Poulson's solution to this nation's $20 trillion federal debt crisis, and the impending financial collapse of this Nation's economy, calls for a new fiscal rule, a national debt brake, similar to the fiscal rules enacted in Switzerland.
The Swiss Debt Brake requires that expenditures are equal to revenue in a given year adjusted for the ratio of actual income to potential income.
Potential income is estimated using the trend rate of growth in income in prior years..."

Tuesday, October 27, 2015

We’re Probably Screwed

We’re Probably Screwed | Intellectual Takeout
According to the United States Treasury, the total national debt is $18.2 trillion. The annual, average interest rate on the debt as of July of 2015 is 2.3%, down from 2.4% in July of 2014. Here’s why that’s a problem.
Low interest rates mean low carrying costs for debt. If the interest rate is 10%, you’re monthly payment on a $250,000 house is going to be substantially more than if the interest rate is only 4%. The same principle applies to the national debt. We’ve been able to increase the amount of debt, just like people can buy a more expensive house, but keep the annual debt costs low with low interest rates.Here’s a chart provided by the United States Treasury that shows the annual national debt payments going back 15 years. As you can see, the annual amount paid has fluctuated between $454 billion and $318 billion.
While those numbers represent a big swing percentage-wise, it’s not that big considering how much the national debt has risen since 2000. Take a look: 
At the beginning of 2000, the national debt was less than $6 trillion. It is now over $18 trillion. That’s a three-fold increase in 15 years! Recall that the payment on the national debt has not seen a three-fold increase. The average annual payment on the debt between 2000 and 2015 was $386 billion. If that payment had tripled, we’d be in trouble.
Why? Because of the realities of tax revenues and the federal budget.
In 2015, the White House’s budget expects $3.18 trillion in tax revenue while spending $3.8 trillion. If those projections are proven true, then the country will add $583 billion to the national debt in fiscal year 2015. Here’s the chart:
When you dig through the rest of the budget, you will find that only $229 billion is budget for payments on the national debt. That’s a lot less than the $351 billion in interest payments that the Treasury expects to accrue in fiscal year 2015.
Setting aside the discrepancy, let’s just run with the budgeted numbers. As a portion of total federal spending, including mandatory spending such as Social Security and Medicare, payments on the national debt at a 2.3% interest rate are currently 6% of all spending. Here’s the chart from National Priorities:
To put things in perspective, the biggest chunks of the pie are as follows: Social Security is 33%, Medicare is 27%, military spending represents 16%, and debt payments represent 6%. That leaves 18% of the federal budget for everything else that the government does including courts, transportation, environment, energy, agriculture, etc. Don’t forget that to achieve those spending levels in 2015, the U.S. is required to borrow over $500 billion. And, again, more than $350 billion will be owed in interest alone on the national debt in 2015.  
Here’s the big problem to keep in mind: the interest rate on the $18 trillion and rising national debt. As it is, 6% of all federal spending goes to service the debt. What if that number jumps higher?
Despite the fact that the national debt has tripled since 2000, the amount paid to service the debt hasn’t changed that much over the last decade and a half because the interest rate has been held so low. But now we are potentially heading into an era of rising interest rates. Keep in mind that we are at 40-year lows for the interest rates on the national debt. See the chart below from the Congressional Budget Office:
An interest rate of 4%, 6%, or even 8% isn’t that hard to imagine down the road when you consider the recent past. It’s especially realistic when you consider that the interest on that national debt got to 14% in the 1980s!
What would happen to our budget if the interest rate rose to historical levels given our current revenue and budget?
  • At the current 2.3% interest rate on $18.2 trillion in national debt, we have accrued $351 billion in interest, but we’re only budgeted to pay $229 billion, which is 6% of total spending and 7.2% of actual tax revenue.
  • At a 4% interest rate on $18.2 trillion in national debt, the amount accrued in interest annually would be $728 billion, which is 19% of total spending and 23% of actual tax revenue.
  • At a 6% interest rate on $18.2 trillion in national debt, the amount accrued in interest annually would be $1.09 trillion, which is 29% of total spending and 34% of actual tax revenue.
  • At an 8% interest rate on $18.2 trillion in national debt, the amount accrued in interest annually would be $1.456 trillion, which is 39% of total spending and 46% of actual tax revenue.
  • At a 10% interest rate on $18.2 trillion in national debt, the amount accrued in interest annually would be $1.820 trillion, which is 48% of total spending and 57% of actual tax revenue.
One could keep going higher with the interest rates, but there is no sense in it. At an 8% interest rate, if mandatory spending levels on Social Security and Medicare are left unchanged (currently 60% of total federal spending), then there is no military, no federal courts, no EPA, no spending on roads, nothing. There simply is no money to spend on those items if we're to keep paying our debt obligations.
We got away with increasing the national debt exponentially in a very short time because of a low-interest rate environment. But are you willing to bet that interest rates will always be rock-bottom?
If you’re a young American, welcome to your inheritance.

Thursday, August 13, 2015

Criminal liars!!!-----150 Days: Treasury Says Debt Has Been Frozen at $18,112,975,000,000

150 Days: Treasury Says Debt Has Been Frozen at $18,112,975,000,000
(CNSNews.com) - The portion of the federal debt that is subject to a legal limit set by Congress closed Monday, August 10, at $18,112,975,000,000, according to the latest Daily Treasury Statement, which was published at 4:00 p.m. on Tuesday.
That, according to the Treasury's statements, makes 150 straight days the debt subject to the limit has been frozen at $18,112,975,000,000.
$18,112,975,000,000 is about $25 million below the current legal debt limit of $18,113,000,080,959.35.
On July 30, Treasury Secretary Jacob Lew sent a letter to the leaders of Congress informing them that he was extending a “debt issuance suspension period” through October 30.
In practice, that means that unless Congress enacts new legislation to increase the limit on the federal debt before then, the Treasury will continue for at least the next eleven weeks to issue Daily Treasury Statements that show the federal debt subject to the limit beginning and ending each day frozen just below that limit.
...In his March 13 letter, Lew explained some steps the Treasury would take during the debt issuance suspension period.
“Because Congress has not yet acted to raise the debt limit,” Lew said in that letter, “the Treasury Department will have to employ further extraordinary measures to continue to finance the government on a temporary basis. 
Therefore, beginning on March 16, I plan to declare a ‘debt issuance suspension period’ with respect to investment of the Civil Service Retirement and Disability Fund and also suspend the daily reinvestment of Treasury securities held by the Government Securities Investment Fund and the Federal Employees’ Retirement System Thrift Savings Plan.”...

Thursday, March 31, 2016

In CBO’s Projections, a Growing Reason to Worry About the Federal Debt

In CBO’s Projections, a Growing Reason to Worry About the Federal Debt - Washington Wire - WSJ
"Convincing Americans that they should worry about the federal deficit and debt is tough, despite all those warnings about the inevitable crisis.
Brookings Institution chart of projected increase in interest obligations on federal debt, based on data from the Office of Management and Budget and the Congressional Budget Office.The federal debt, the sum total of all the government’s past borrowing, is huge by historical standards: bigger as a share of the economy than at any time in U.S. history except for World War II. Yet the U.S. Treasury still is able to borrow billions every day at very low interest rates. Investors demand less than 2% to lend to the Treasury for 10 years.
But the trajectory of the debt is worrisome for one inescapable reason:
When you owe a lot of money and interest rates rise, your interest tab mounts.
Today, interest consumes a bit more than 6% of all federal outlays. 
But the latest Congressional Budget Office baseline projections suggest that, without new tax or spending legislation, interest will account for more than 13% of all federal outlays in 2026. 
That’s partly because interest rates are expected to rise from today’s very low levels; CBO expects the average yield on 10-year Treasury notes, now around 1.9%, to climb to 4.1% over the next decade.
There will also be more debt on which to pay interest because the government will be borrowing each year to cover the deficit."

Monday, August 21, 2017

ANOTHER RECORD: President Trump Cuts More US Debt for a Longer Period of Time Than Any President in History

ANOTHER RECORD: President Trump Cuts More US Debt for a Longer Period of Time Than Any President in History:
"It’s Now Official – No President in US History has Cut More from the US Federal Debt for a Longer Period of Time than President Donald J. Trump.
President Trump now can claim the longest and largest decrease of US Federal Debt in US history.
Image result for trump thumbs upWhen President Trump was inaugurated on January 20, 2017 the amount of US Federal Debt owed both externally and internally was over $19 Trillion at $19,947,304,555,212. 
As of August 17th the amount of US Debt had decreased by more than $100 Billion to $19,845,188,460,167.
No President in US history has ever cut the amount of US Debt by this amount and no President has resided over a debt cut like this ever. 
History buffs may say that this is incorrect because President Bill Clinton and President George W. Bush oversaw US Debt cuts over a period of a few years after the Republican Congress led by House Speaker Newt Gingrich forced Clinton into signing a balanced budget. 
We thought the same, but our analysis determined that this is actually not correct.
Congress did push Clinton into signing a balanced budget but the amount of US debt during this period actually increased. 
This is confirmed through data maintained by the US Treasury at Treasurydirect.gov..."

Saturday, August 27, 2016

CBO: Federal Debt to Hit $28.2 Trillion Over Next Decade

CBO: Federal Debt to Hit $28.2 Trillion Over Next Decade:
"Policies like Obamacare, tax code reduce Americans’ incentive to work
Outstanding federal debt is projected to hit $28.2 trillion over the next decade, according to a report from the Congressional Budget Office.
Image result for Federal DebtAt the end of this year, outstanding federal debt is expected to climb to $19.4 trillion and to rise by $8.8 trillion in the next ten years.
The federal government’s budget deficit, which is the difference between how much money the government spends and how much money it takes in through tax collection, will be $590 billion by the end of 2016, $152 billion more than the previous year.
Government spending is projected to increase by 5 percent, or $178 billion, while government revenue is projected to increase by less than 1 percent, or $26 billion.
...The White House did not respond to requests for comment."

Tuesday, May 03, 2016

In 6 Months Since Budget Deal: Debt Up More Than $1 Trillion

In 6 Months Since Budget Deal: Debt Up More Than $1 Trillion:
"In the six months that have passed since then-retiring House Speaker John Boehner and Senate Majority Leader Mitch McConnell cut a budget deal with President Barack Obama that suspended the legal limit on the federal debt until March 15, 2017, the federal debt has increased by more than $1 trillion.
The Senate passed “The Bipartisan Budget Act of 2015” with a vote held in the early morning hours of Friday, Oct. 30. Obama signed it on Monday, Nov. 2.
At the close business on Oct. 30, 2015, the total federal debt was $18,152,981,685,747.52.
By the close of business on April 28, 2016—the latest date for which the Treasury has published the number--the total federal debt was $19,186,207,744,589.55.
That is an increase of $1,033,226,058,842.03..."

Wednesday, July 16, 2014

Message From The CBO: 'WAKE UP!! It's Still The Economy Stupid'

"The Lid": Message From The CBO: 'WAKE UP!! It's Still The Economy Stupid'
Message From The CBO: 'WAKE UP!! It's Still The Economy Stupid'


Over the last few months our attention has turned away from the economy.  Not that there hasn't been other important things to worry about, presidential scandals, affronts against our first amendment rights by Obamacare and the IRS, and our fourth amendment right by the NSA, the infighting in the GOP, the IRS hiding evidence, problems overseas, the loss of US credibility,  etc. and so on.   A report by the CBO issued yesterday should remind us of what we've forgotten ---it's the economy stupid!

The United States is still spending too much, the economy is slowing down, entitlements are still strangling our budgets, tax rates are too high, and the national debit is threatening our future.


According to the CBO budget deficits are projected to rise steadily and, by 2039, to push federal debt held by the public up to a percentage of GDP seen only once before in U.S. history (just after World War II). The harm that such growing debt would cause to the economy is not factored into CBO’s detailed long-term projections but is considered in further analysis presented in this report.

These are the issues that the GOP needs to focus on, these are the Issues that threaten our future and the future of our children. Key points from CBO’s Long-Term Budget Outlook report:
  • Federal Debt Is Soaring: The debt has doubled since the onset of the financial crisis, and CBO concludes the growth in the debt is “unsustainable.”
  • Now Is the Time to Act: CBO says that prompt decisions to rein in future deficits, would expand employment and economic growth.
  • The Economy Is Slowing Down: CBO has again lowered its projection of GDP growth, and the average number of hours worked by Americans is shrinking.
  • Spending Is Still the Problem: Major entitlements and interest on a growing stock of debt will cause real spending to soar by 27 percent over the next two decades.
  • Raising Taxes Will Cost Jobs: Taxes will exceed their historic average level this year, and they are on pace to rise even further. Yet these tax increases still never match the pace of spending, even while they discourage work, saving, and investment.
  • Entitlement Reform Is Key: We run the risk of breaking our promise to seniors and future generations if we don’t reform our entitlement programs soon. CBO has increased their measure of Social Security’s unfunded liability by 25 percent.
  • The Debt Threatens Our National Security: CBO warns that our growing national debt could compromise national security by constraining defense spending and limiting the country’s ability to prepare for future challenges.
In response to the report, House Budget Committee Chairman Paul Ryan(R-WI) issued the following statement:
“If this report tells us anything, it’s that the status quo isn’t working, and families are paying the price. We need to expand opportunity for everyone in this country, and we can start by getting federal spending and debt under control. That’s how we can make the federal government more accountable and more effective.”
The full CBO report is embedded below:

Thursday, August 07, 2014

Guess What Obama Has Racked Up More of Than All the Presidents From Washington to Clinton Combined

Guess What Obama Has Racked Up More of Than All the Presidents From Washington to Clinton Combined
"Remember when President Barack Obama boasted of lowering the debt by half? Or when, in 2008, Obama accused President George W. Bush of being “unpatriotic” for taking out a “credit card in the name of Bank of China.”
Well, it appears that Obama has reached his self-defined “unpatriotic” zone himself. According to CNS News, the new debt increase from the Obama administration is more than all of the presidents from George Washington to Bill Clinton COMBINED:
federal-debt
- The total federal debt of the U.S. government has now increased more than $7 trillion during Barack Obama’s tenure as president.
- When President Obama took office on Jan. 20, 2009, the total federal debt was $10,626,877,048,913.08. Now it has risen to $17,618,599,653,160.19 — up $6,991,722,604,247.11 from Obama’s first day on the job.
- The $7,060,259,674,497.51 in new debt alone from Obama’s presidency is $61,341.82 per household.

Tuesday, November 05, 2013

$409 BILLION increase in just ONE MONTH!!!! ------Federal Debt Jumped $409 Billion in October; $3,567 Per Household

Federal Debt Jumped $409 Billion in October; $3,567 Per Household | CNS News:
"The debt of the federal government, which is normally subject to a legal limit, jumped by $409 billion in the month of October, according to the U.S. Treasury.
That equals approximately $3,567 for each household in the United States, and is the second-largest one month jump in the debt in the history of the country.
...The single greatest one-month increase in the federal government's debt came in October 2008, when Congress enacted the Troubled Asset Relief Program to bail out the financial industry.
In that month, the debt subject to the legal limit climbed by about $545 billion."

Thursday, March 25, 2010

hidden cost of government

The Free Enterprise Nation - hidden cost of government
"the actual unfunded liability for these public sector pension plans would be $3.5 trillion if more realistic and conservative interest rate assumptions were utilized.

Attempts by others to determine the true federal debt (including unfunded obligations) result in the determination that if one federal “balance sheet” were utilized, the total federal debt would exceed $107 trillion, not the $12.3 trillion currently stated as “debt”.

The result is that the total federal and non-federal debt (if unfunded liabilities are included) is an estimated $112+ trillion, or SEVEN TIMES higher than the total $15 trillion currently disclosed to taxpayers.!!"

Friday, May 22, 2015

It Is Mathematically Impossible To Pay Off All Of Our Debt

It Is Mathematically Impossible To Pay Off All Of Our Debt
Did you know that if you took every single penny away from everyone in the United States that it still would not be enough to pay off the national debt?  
Today, the debt of the federal government exceeds $145,000 per household, and it is getting worse with each passing year.  
Many believe that if we paid it off a little bit at a time that we could eventually pay it all off, but as you will see below that isn’t going to work either.  
It has been projected that “mandatory” federal spending on programs such as Social Security, Medicaid and Medicare plus interest on the national debt will exceed total federal revenue by the year 2025.  
That is before a single dollar is spent on the U.S. military, homeland security, paying federal workers or building any roads and bridges.  
So no, we aren’t going to be “paying down” our debt any time in the foreseeable future. 
And of course it isn’t just our 18 trillion dollar national debt that we need to be concerned about.  
Overall, Americans are a total of 58 trillion dollars in debt.  
35 years ago, that number was sitting at just 4.3 trillion dollars.  
There is no way in the world that all of that debt can ever be repaid.  
The only thing that we can hope for now is for this debt bubble to last for as long as possible before it finally explodes.
It shocks many people to learn that our debt is far larger than the total amount of money in existence.  
So let’s take a few moments and go through some of the numbers.
Read it all and weep.

Tuesday, September 19, 2017

What the $20 Trillion National Debt Means to You - Just Facts

What the $20 Trillion National Debt Means to You - Just Facts
"On September 8, 2017—the same day that Congress and President Trump passed a law suspending the federal debt limit until December—the official debt of the U.S. government surpassed the milestone of $20 trillion, reaching exactly $20,162,176,797,904.
To personalize that figure, it amounts to an average of $61,889 for every person in the United States, or $160,247 per household.
Adjusted for inflation, these debt burdens have been larger for the past year than ever recorded in the history of the U.S.:

To place the per-household federal debt in another context, it is 35% higher than the average consumer household debt of $118,271, including mortgages, car loans, credit cards, and student loans..."
Read on!

Sunday, December 13, 2020

Some info for you about US federal government debt.

  • Current "National Debt" $27 TRILLION. This number is ONLY the amount owed by US gov. to US Treasury bond holders/purchases. Individuals, corporations, countries. Does not include unfunded liabilities like SS, Medicare, etc. which equal $156 TRILLION. 
  • Again, this info is US federal gov. only (not state or municipal) debt and unfunded (promises to pay but no money in fund to pay for it) SS and Medicare. 
  • Does not include unfunded Medicaid funding, government employee pensions (military/federal gov employees), VA medical shortfalls.
A link to my blog posts about debt over the years. Note the date of each article. https://muskegonpundit.blogspot.com/search?q=federal+debt&max-results=20&by-date=false

"Debt Clock" link. https://www.usdebtclock.org/ 

Below: SS/Medicare/other unfunded liability only. Note "liability per citizen".

Compare with "Assets per Citizen":

Note "US Federal Debt to GDP Ratio" growth at bottom of image.

Happy days!